

LEARN | Module 7
Diagnosis and Likelihood Ratios
In a clinical situation, clinicians generate a differential diagnosis that includes the most important possible causes and then use various pieces of information (e.g. history, physical examination, clinical laboratory tests and radiographic studies) to help refine the probability of disease for each significant possible diagnosis.
Diagnostic tests may include any type of information that could be helpful in making a diagnosis, including history taking and physical examination, but the term is usually applied to ward, laboratory or imaging tests. In this module, the term “diagnostic tests” will include physical signs.
The usual reasons given for ordering diagnostic tests are to identify the disease responsible for a patient’s symptoms, to make an informed decision about treatment and to give patients more accurate information about prognosis. However, ultimately, the most important reason we order diagnostic tests is to refine the probability of the presence or absence of disease. The results of diagnostic tests change the likelihood of a particular diagnosis.
This way of thinking is becoming more and more important as we move from the 20th century into the IT-driven world of the 21st century, with access to information increasingly available at the point of care.
This week's content is summarised in the following video and expanded upon below.
The Process of Diagnosis
Diagnosis requires us to think about where the pathology is and what it is. As we elicit further information from the patient, via history, examination and investigation, we can narrow our differential diagnosis.
For example, a 65-year-old thin, worried-looking man tells you he has been having increasing difficulty swallowing food for 4 months and has lost a lot of weight. He will be worried this is cancer and so should you! You ascertain he has never had anything like this before, and apart from treatment for high blood pressure, has been well.
Our DDx at this stage includes carcinoma of the oesophagus, gastro-oesophageal reflex (GORD) and lower oesophageal stricture.
Further history is elicited:
He has had no symptoms gastro-oesophageal reflux
Lumps of meat seem to stick behind the lower sternum, which he indicates by pointing, 3 months ago, and his wife now blends all his food
He has no appetite
He feels weak
This information almost completely rules out GORD and lower oesophageal stricture, and points towards carcinoma of the oesophagus. But why?
Because clinical experience tells us that:
If a patient has no symptoms of GORD, the likelihood of them having GORD is decreased
If a patient feels weak and has loss of appetite, the likelihood of them having cancer is increased
If a patient has food getting stuck behind the lower sternum, the likelihood of them having oesophageal cancer is increased
Yet clinical experience, whilst important, is a low level of evidence – you are placing all your trust in one person! A higher level of evidence, as discussed in Module 1, is peer-reviewed research. By studying the symptoms and signs of many people both with and without disease, we can work out just how much each particular feature increases the likelihood of a particular disease. This is known as the likelihood ratio. Of course, this can be applied to investigations, as well as symptoms and signs.
In the above history, we paused halfway through and thought about a differential diagnosis. We then applied a "diagnostic test", asking about loss of appetite. We then thought about the differential diagnosis again. This splits the thought process into:
What we think before the test
The information the test provides
What we think after the test
This can be better defined as:
Pre-test probability – the probability the patient has the disease before undergoing a test
Likelihood ratio – how much the diagnostic test increases/decreases the probability of disease
Post-test probability – the probability the patient has the disease given the result of the test
The initial pre-test probability is best obtained from published data on the prevalence of disease in the patient population. For example, if an Australian you know nothing about walks into your office, they have a 0.5% chance of having cancer.
The likelihood ratio is calculated as:

The post-test probability can then be worked out by using a nomogram (discussed later).
Likelihood Ratio
To determine a numerical value for our likelihood ratio, we need to first think about sensitivity and specificity.
Imagine a population of 200 people. 150 of these people have a disease and 50 of these people do not. However, a new (not completely accurate) diagnostic test has the following results: 160 people test positive, and 40 people test negative. This information can be represented in the following table:
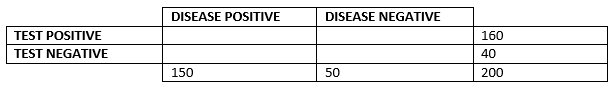
You will notice that part of the table is yet to be filled in – and this is the most important part. How many of the people the test said was positive truly had the disease? And how many of the people it said were negative were truly healthy? Imagine that 140 of those that tested positive truly had the disease. And 30 of those that tested negative truly were healthy.
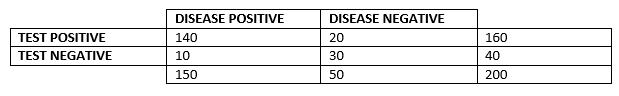
We call the 140 people who tested positive and actually had the disease true positive.
We call the 20 people who tested positive but actually were healthy false positive.
We call the 30 people who tested negative and actually were healthy true negative.
We call the 10 people who tested negative but actually had the disease false negative.
But absolute numbers are rarely useful in statistics – we want to know relative proportions. Hence, we talk about:
Sensitivity – the probability of a positive test, in someone with the disease
This is equal to the true positive (140) divided by the total with disease (150) = 93%
Specificity – the probability of a negative test, in someone without the disease
This is equal to the true negative (30) divided by the total without disease (50) = 60%
In practice, a sensitivity of 93% can be translated as most of the people with the disease will test positive. Therefore, if you don't test positive (you test negative), you probably don't have the disease! This can be remembered as SnNOut (if sensitive, when negative, rules out).
A specificity of 60% is bad and can be translated as only 60% of the people who are healthy will test negative. Therefore, the remaining 40% of people who are healthy will be testing positive!
If the specificity was higher, it could be translated as most of the people who are healthy will test negative. Therefore, if you don't test negative (you test positive), you probably aren't healthy! This can be remembered as SpPIn (if specific, when positive, rules in).
You will often see sensitivity and specificity reported in research, so it is useful to know what they actually mean. Now knowing what sensitivity and specificity are, let's get back to likelihood ratios.
So, we defined a likelihood ratio as:

There will be a different likelihood ratio for positive test results and negative test results.
The likelihood ratio for positive test results is:

The probability of a positive test result in a patient with the disease is the sensitivity!
The probability of a positive test result in a patient without the disease is related to the specificity.
If the specificity is 60%, that means 60% of people without the disease have a negative test result and, therefore, 40% of people without the disease have a positive test result. (Intuitively, you worked this out by taking 100% - 60% = 40%.)
Because specificity is usually reported as a decimal (0.60) rather than percentage (60%), this means that the probability of a positive test result in a patient without the disease is equal to (1 - specificity).
So, we arrive at the conclusion that:

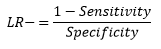
The likelihood ratio for negative test results is:

Using similar reasoning to previously, we arrive at the conclusion that:
What does it all mean?
A likelihood ratio of:
1 means that the test provides no additional information (the likelihood of DDx doesn't change)
>1 means the likelihood of disease is increased (>10 means a big increase!)
<1 means the likelihood of disease is decreased (<0.1 means a big decrease!)
Nomogram
Nomograms are used to combine the pre-test probability and the likelihood ratio and find out the post-test probability. Look at the following example, in which a 50-year-old male presents to the ED.
The pre-test probability of having a myocardial infarction is 5% (prevalence in the community at his age)
The likelihood ratio of crushing central chest pain indicating MI is 1.44

Therefore, the post-test probability of having an MI is 10%
Further examples are shown in the detailed notes for this week.
Further reading
YouTube video on sensitivity and specificity