

LEARN | Module 6
Case-Control Studies and Harm
As always, please post any questions, comments or suggestions in the Disqus comment feed at the bottom of the module!
Case-Control studies
Case-control studies are a retrospective study design that may be carried out in a short period of time to form initial conclusions on a topic. Rare outcomes, or those that take a long time to develop, may threaten the feasibility of cohort studies. The case-control study identifies cases, i.e. patients with the target outcome, and the selection of controls, i.e. persons who don’t have the outcome of interest. Investigators may then assess the relative frequency of previous exposure to risk factors/harmful exposures in the cases and controls.
In summary, case-control studies identify an outcome and then look back (retrospectively) at exposures.
Bias
Information on exposures is almost always retrospective with case-control studies. Exposure data may be collected via interview (face to face, telephone, email, postal, etc.), from records (medical, work or other sources) or biological samples. The procedure for both cases and controls should be identical to avoid observer/detection bias. Another form of bias is reporting/recall bias, when knowledge of being a case or control may affect the manner in which an individual remembers a certain event or exposure.
Measuring Effect
Unlike a cohort study, a relative risk cannot be calculated – this is because the total number of people exposed are not known. Instead, we need to find the odds ratio (OR) – this is the odds of being exposed to something if you have a disease vs. the odds of being exposed to something if you do not have a disease.
For example, imagine that 100 men have prostate cancer (cases). Of these, 17 had previously had a vasectomy (exposed) and 83 had not (not exposed). Additionally, 1053 men do not have prostate cancer (controls). Of these, 158 had previously had a vasectomy (exposed) and 895 had not (not exposed). The following table can be formed:
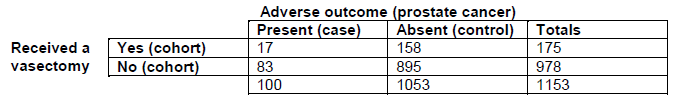
The odds of being exposed to something if you have a disease are people with the disease who were exposed divided by people with the disease who were not exposed (e.g. 17/83)
The odds of being exposed to something if you do not have a disease are people without the disease who were exposed divided by people without the disease who were not exposed (e.g. 158/895)
The odds ratio is the ratio of these two odds (e.g. (17/83)/(158/895) = 1.16)
An odds ratio of 1.16 indicates that the odds of being diagnosed with prostate cancer are increased by 16% in men that had a vasectomy, compared to those that did not.
An OR >1 indicates harm (an adverse effect is more likely to occur given the exposure)
An OR =1 indicates that the adverse event is no more likely to occur than without the exposure
An OR <1 indicates benefit (an adverse effect is less likely to occur given the exposure)
Number Needed to Harm
We then need to calculate the number needed to harm (NNH). This is the number of people that would have to be exposed to a particular exposure in order for one person to end up with the harmful outcome. In order to calculate this, you need to know two things:
Patient expected event rate (PEER) – this refers to the rate we would expect in a patient who received no exposure, estimated to be similar to the background prevalence of the general population
Odds ratio
Once you know these two things, you can either use a formula or look up the value using a table:
The formula is NNH = [ PEER (OR-1) + 1 ] / [ PEER (OR-1) x (1-PEER) ]
Tables are available here
Video on Case-Control studies and Harm
The following video will further explain case-control studies.